[1] 22 5 8Math 430: Lecture 2a
Foundations for Statistical Inference
Professor Catalina Medina
Research process
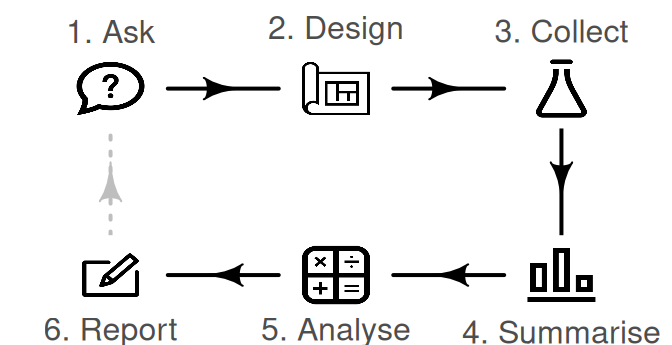
Image from https://bookdown.org/pkaldunn/SRM-Textbook/Intro.html
Research questions
Consider the following three research questions:
- What is the average mercury content in swordfish in the Atlantic Ocean?
- Do domestic cats live longer than domestic dogs on average?
- Does a new drug reduce the number of deaths in patients with severe heart disease?
Population
Each research question refers to a target population
- What is the average mercury content in swordfish in the Atlantic Ocean?
- Do domestic cats live longer than domestic dogs on average?
- Does a new drug reduce the number of deaths in patients with severe heart disease?
Data
If we were able to collect data on everyone in our target population we would have a census
If we can only collect data on a proportion of the population we have a sample
Parameter versus statistic
We want to understand something about the population, the population parameter
Since we can typically only obtain a sample, we use a sample statistic to infer about the population parameter
Example: What is the average mercury content in swordfish in the Atlantic Ocean?
Population parameter: Average mercury content in all swordfish in the Atlantic Ocean (\(\mu\))
Sample statistic: Average mercury content in swordfish in our sample of fish from the Atlantic (\(\bar{x}\))
Sampling methods
We want the data in our sample to be as representative of our population as possible, to reduce bias
Recall \(E[\bar{x}] - \mu\)
Bias refers to any systematic misrepresentation of the target population or a parameter caused by the sampling or the study design.
Example
Do CSUCI students who exercise regularly have higher GPA?
Consider that we design a survey with the following questions to study the research question.
Do you exercise at least once every week?
What is your GPA?
Convenience (Availability) Sampling
Convenience sampling occurs when a specific sample is selected because the sample is easy to access.
Example: Do CSUCI students who exercise regularly have higher GPA?
- Stand in front of the Broome library
- Give the survey to 100 CSUCI students
This could introduce (sampling) bias and the findings may not generalize to the population. It is possible that those in front of the library
- may study more and thus may have higher GPA
- may be more active than those who study at home
Simple random sample
We typically want a simple random sample. Meaning each case in the population has an equal chance of being included and the cases in the sample are not related to each other.
Example: Do CSUCI students who exercise regularly have higher GPA?
The researcher can - reach out to the registrar to get student emails - randomly select and email the survey to 100 students
Simple Random Sampling in R
This allows us to sample 3 numbers from 1 to 100 without replacement, meaning a number can only be selected once.
Non-response Bias
Even when simple random sampling is used, if participants are unwilling to participate in studies then the results can have nonresponse bias.
Example
It is unlikely that 100 students will respond. Assume that 86 respond.
It is possible that those 14 who did not respond
- may be busy exercising and did not have the time to respond.
- may be busy studying and did not have the time to respond.
Cluster Sampling
In cluster sampling the population is divided into group (i.e, clusters). The sample consists of elements in randomly selected clusters.
Example
The researchers may get a list of classes taught at CSUCI. They randomly select 10 classes. All the students in those 10 classes will be in the sample.
Stratified Sampling
In stratified sampling the population is first divided into groups (i.e., stratas) and then the sample is selected randomly within each strata.
Example
The researchers suspect that exercising patterns might be different across different class years. Thus they want to make sure that the sample includes first-years, sophomores, juniors, and seniors. They get a list of students with class year information from the registrar. They then randomly select 25 students who are first years, 25 sophomores, 25 juniors, and 25 seniors.
Study design
Observational Study
In observational studies, researchers study the research question without exposing the cases (or subset of a sample) to any treatment or intervention. In observational studies causal relationships between variables cannot be established.
Example
Based on the survey, even if we observe that CSUCI students who exercise regularly have higher GPA, we cannot conclude that exercising regularly increases GPA.
Relationship between two variables
If two variables are related to each other in some way we would call them associated.
If two variables are not related to each other in any way we would call them independent.
Relationship between two variables
When we examine the relationship between two variables, we often want to know if the relationship between them is causal. In other words, does one variable cause the other? For instance, is exercising the reason for higher GPA? We don’t know!
When we suspect that two variables have a causal relationship we can say
The explanatory variable (e.g. exercising) might causally affect the response variable (e.g. GPA).
Relationship between two variables does not imply one causes the other.
Relationship between two variables
Explanatory variables are denoted by \(x\) and the response variable is denoted by \(y\).
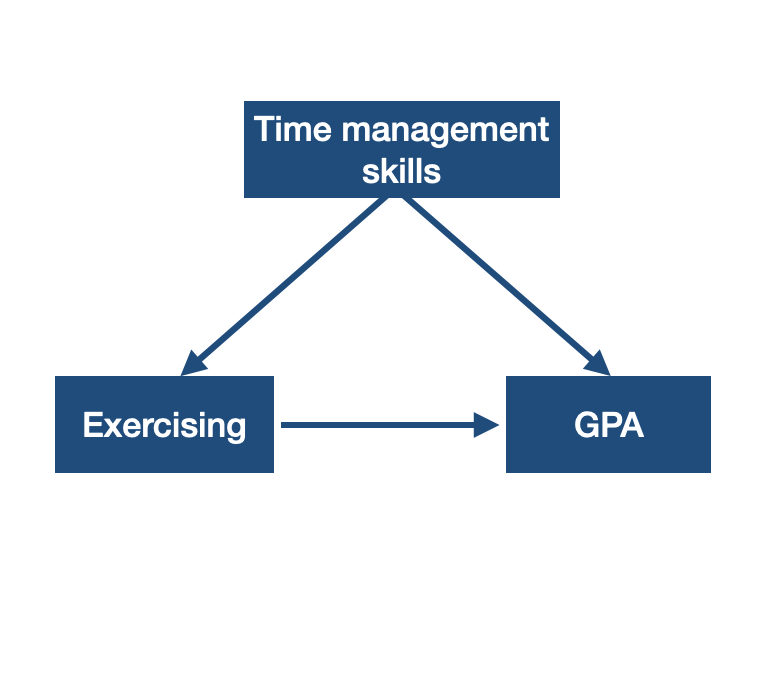
A confounding variable (e.g. time management skills) has a correlation with the the explanatory and the response variable.
Experiment Design
In experiments, researchers assign cases to treatments/interventions.
In randomized experiments, researchers randomly assign cases to treatments/interventions. In order to establish causal link between variables, we need randomized experiments.
Randomization helps control for confounding, but is not always ethical.
Example
Do CSUCI students who exercise regularly have higher GPA?
Does exercising regularly increase GPA for CSUCI students?
Note
Random sampling and random assignment (i.e., random allocation) serve different purposes.
Random sampling
method of choosing sample from the population
the goal is to establish generalizability
Random allocation
method of assigning the sample to different treatment groups
the goal is to establish causality.